


If you only look at headlines, 2025 can feel confusing for financial services M&A. Deal counts are barely moving. Funding stories are uneven. Some subsectors feel quiet while others are suddenly on fire.
But when you zoom out and look at the full system rather than isolated transactions, a very different picture emerges.
The Financial Services M&A Analysis 2025 market map brings that system into focus. It compresses market activity, subsector momentum, growth themes, technology layers, and execution dynamics into a single strategic view. And when you read it from start to finish, one message becomes impossible to ignore.
This is not a volume cycle.
This is a value expansion cycle.
Below, we break down what the map shows, how to read it, and why it matters for corporate development, strategy, and innovation leaders navigating financial services today.
2025 is a value year, not a volume year
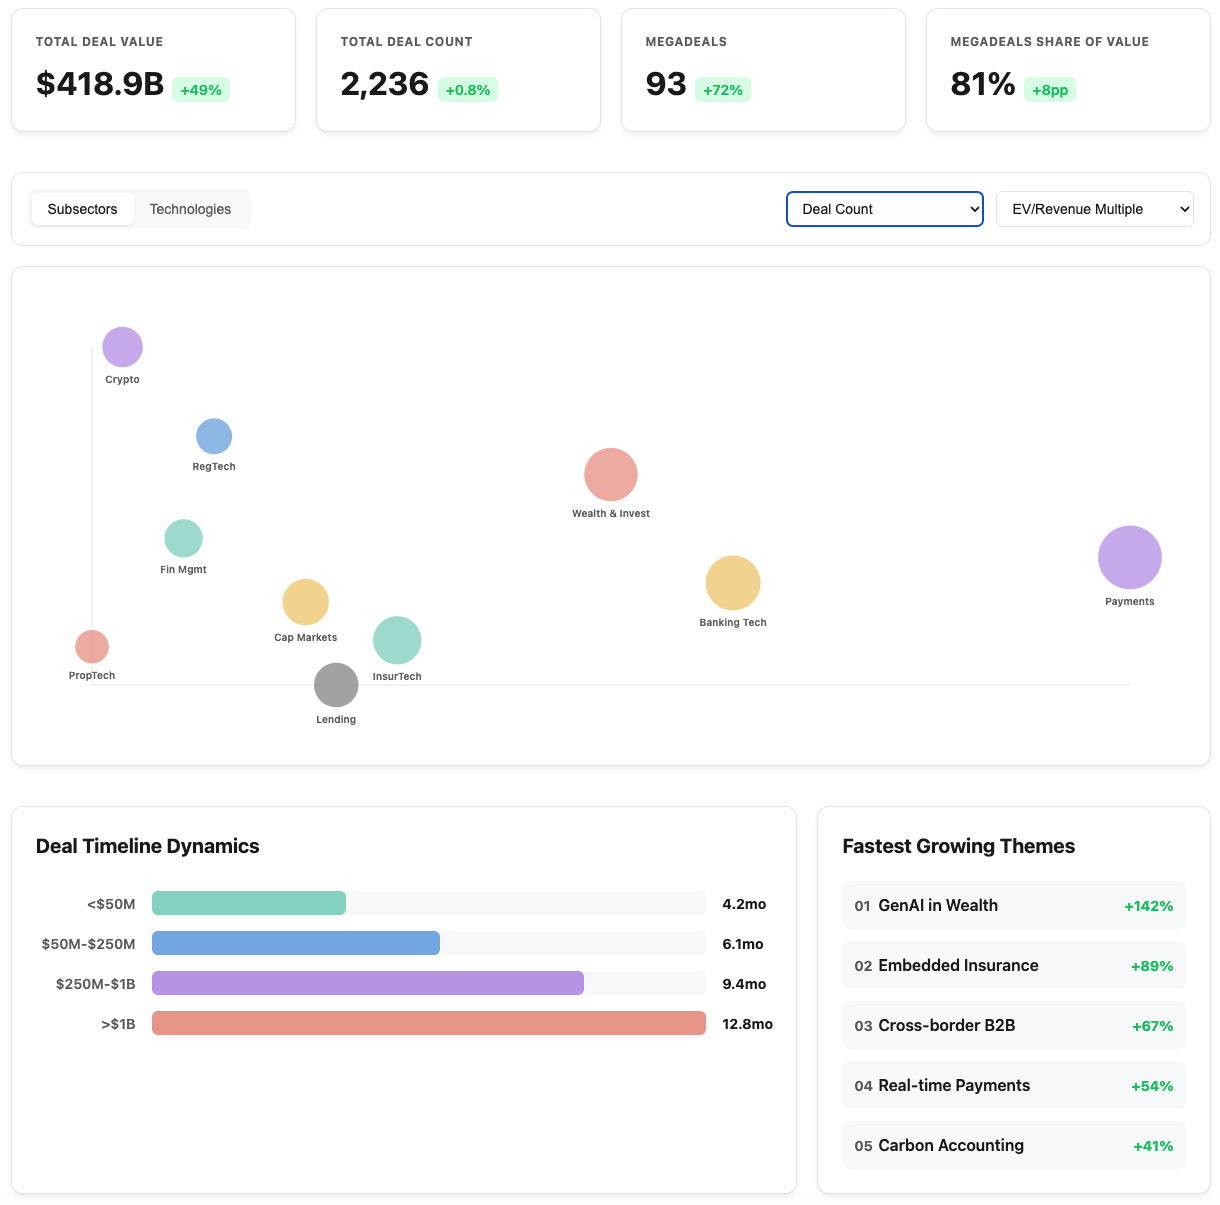
The first thing the chart makes obvious is that deal activity and deal value have fully decoupled.
Deal count in 2025 is essentially flat, up just +0.8% to 2,236 transactions. On its own, that could suggest a cautious or stagnant market.
But total deal value tells the real story.
Global financial services M&A reached $418.9B, up +49% year over year.
That gap between flat volume and surging value is the defining feature of the market right now. Buyers are not doing more deals. They are doing much bigger ones.
This is not about incremental bolt-ons or experimental acquisitions. Capital is being deployed selectively, at scale, and with conviction.
Megadeals now define the market
Nothing illustrates this shift better than the rise of megadeals.
In 2025, there were 93 deals over $1B, a +72% increase year over year. These transactions now account for 81% of total deal value, up from roughly 73% last year.
That means more than four out of every five dollars in financial services M&A is concentrated in a relatively small number of transactions.
This level of concentration changes how the entire market behaves.
Competition intensifies around strategic assets. Execution risk matters more. Due diligence becomes deeper and more technology-driven. And smaller, non-strategic assets increasingly get deprioritized.
The market has clearly shifted away from opportunistic dealmaking toward transformational M&A.
The payments infrastructure sits at the center of gravity
At the core of the subsector view, payments and payment infrastructure stand out immediately.
This is the largest segment on the map, anchored by platform-scale transactions such as Global Payments acquiring Worldpay in a $24.25B deal.
Valuations in payments infrastructure are clustering around 4.5x EV to revenue, reflecting both scale and durability rather than speculative growth.
The drivers are structural.
Real-time payments are becoming table stakes. Embedded finance is moving from edge cases to core workflows. And full-stack platforms that combine processing, orchestration, and data are increasingly valuable.
The map assigns a +15% growth outlook to this segment, but the real signal is qualitative. Payments infrastructure is no longer just a subsector. It is the backbone of modern financial services.
InsurTech is consolidating fast and decisively
If payments dominate by size, insurtech dominates by momentum.
By mid 2025, insurtech M&A had already reached $4.8B, exceeding the entirety of 2024. That alone tells you something fundamental has shifted.
Valuations are hovering around 3.8x EV to revenue, and the strategic logic is consistent across deals. Buyers are consolidating platforms, modernizing underwriting, automating claims, and expanding geographically.
AI is not an add-on here, but moreso the economic engine.
Underwriting automation, fraud detection, pricing intelligence, and operational efficiency are driving real margin expansion. As a result, insurance is firmly in platform consolidation mode.
The map makes it clear that insurtech is no longer experimental. It is infrastructure.
WealthTech and asset management command premium multiples
Another area that quietly stands out is wealth technology and asset management infrastructure.
RIA rollups continue to accelerate, and buyers are paying up for sticky, SaaS like revenue models. A clear example highlighted on the map is Clearwater Analytics acquiring Enfusion for $1.5B.
Multiples in this segment are the highest on the chart, reaching ~5.2x EV to revenue.
Why? These platforms sit directly inside mission-critical workflows. Switching costs are high. Data is deeply embedded. And revenue visibility is strong.
In a market increasingly focused on quality rather than quantity, wealth infrastructure checks every box.
FinTech remains high volume but smarter
Broad fintech is still the most active subsector by deal count, with 859 deals year-to-date and $16.7B in total value.
But the composition of those deals has changed.
Roughly 20% of fintech transactions are now AI-enhanced, up from just 8.5% previously. That shift matters. It shows that buyers are no longer acquiring fintech for distribution alone. They are acquiring intelligence.
AI-driven credit scoring, fraud detection, customer analytics, and workflow automation are becoming central to value creation. Fintech without a strong technology edge is increasingly struggling to command attention.
RegTech plays defense but stays essential
RegTech does not dominate headlines, but it maintains steady strategic demand.
Rising regulatory complexity, especially in Europe, combined with cost pressure inside financial institutions, makes compliance automation non-negotiable.
These are defensive acquisitions. They may not generate hype, but they reduce risk, lower operational cost, and improve resilience. The map positions regtech exactly where it belongs: essential, durable, and quietly strategic.
Crypto M&A grows up
The blockchain and crypto segment tells one of the most interesting stories on the map.
Gone are the speculative plays of earlier cycles. In their place are what the map describes as “bridge deals” connecting crypto infrastructure with traditional financial systems.
Cross-border payments, settlement infrastructure, custody, and AI-enabled platforms dominate the activity. This is about integration, not disruption for its own sake.
Crypto M&A in 2025 is infrastructure-driven. And that makes it legible to corporate buyers in a way it has not been before.
Growth themes converge around infrastructure and intelligence
When you step back and look across the fastest growing themes highlighted on the map, a clear pattern emerges.
Insurtech consolidation
Payments infrastructure
AI-integrated fintech
Embedded finance and wallets
Cross-border payments
Every one of these themes points toward the same idea. Financial services M&A is about infrastructure, automation, and intelligence layers.
Distribution still matters. Scale still matters. But technology capability is now the primary acquisition logic.
Technology layers tell the real story
The technology ranking on the map reinforces this shift.
At the top sits AI and machine learning, powering fraud detection, underwriting, document analysis, and workflow automation.
Close behind are cybersecurity and data protection, reflecting rising threats and regulatory pressure.
Blockchain and distributed ledger technologies support smart contracts and cross-border settlement.
APIs and microservices enable interoperability and open banking.
Cloud and SaaS underpin consolidation and migration.
And real time data and analytics support decision-making and model training.
This is about buying capability.
Deal timelines are shrinking, but complexity remains
One of the most practical insights on the map sits at the bottom.
In 2025, the average time to close has improved across deal sizes. Large transactions are closing 30 to 50 days faster than last year.
Deals under $500M close in roughly 80 to 90 days.
$500M to $1B deals take 120 to 140 days.
$1B to $2B transactions land around 140 to 160 days.
And megadeals over $10B still take 200 to 220 days.
Regulatory easing, AI-powered due diligence, better price alignment, and improved capital markets all contribute to this acceleration.
Still, around 40% of deals miss their original target close date, particularly large cross-border transactions. Speed is improving, but complexity has not disappeared.
The big picture
When you connect all five layers of the map, the narrative becomes clear.
Financial services M&A in 2025 is bigger, fewer, and more strategic. Megadeals dominate value creation. Infrastructure and AI sit at the heart of acquisition logic. Payments, insurance, and data platforms are the main battlegrounds.
Execution is faster, but the stakes are higher.
Why this market map matters
Most M&A leaders do not struggle with access to information. They struggle with synthesis.
The Financial Services M&A Analysis 2025 market map is designed to solve that problem. It shows how capital, strategy, technology, and execution interact across the entire ecosystem, not in isolation.
If you want to explore the interactive map, dig into each segment, and understand how these trends apply to your own strategy, you can view it here:
https://www.foundernest.com/financial-services-ma-2025
And if you want deeper market intelligence or tailored mapping across any financial services vertical, you can request a demo and see how FounderNest helps teams move from noise to clarity.
In a market defined by fewer bets and higher conviction, clarity is the real competitive advantage.