Last week, I watched a facilities manager spend fifteen minutes reconfiguring a smart parking system outside our office. It was one of those polished setups that uses sensors, AI, and real time data to direct drivers to open spaces.
Building management spent six figures on it. The irony is that the car park is never more than 60% full. Ever.
The moment stuck with me. Not because the technology was bad, but because it was a perfect example of how innovation spending often works in the real world.
The issue is not always the amount of money being spent. The real problem is the why and the how.
Innovation budgets appear because they feel mandatory. Expensive solutions get deployed in search of a problem. And leaders cite benchmarks that seem widely accepted but rarely understood.
It’s time to bring clarity to the situation. I won’t tell you to think different or fail fast. Instead, I want to put hard numbers on the table. What are companies actually spending on innovation? How does it differ by geography, industry, and stage of growth? And more importantly, how should you think about your own allocation?
The global innovation spending landscape: 2024 to 2025 snapshot
The big numbers
Global innovation budgets continue to rise, with average spend increasing from 6.4% to 6.6% of total revenue.
More than a third of companies now invest 8% or more and corporate R&D reached a record 1.3 trillion dollars in 2024, although growth slowed to just over 3%. At the same time, 27% of the world’s top 100 companies are actively cutting innovation budgets.
This paradox is becoming more visible. Companies have never ranked innovation higher as a strategic priority, yet their readiness to execute has dropped sharply.
83% call innovation a top three priority, but only 3% feel prepared to deliver on those ambitions. The gap between aspiration and capability is widening.
Part of the shift reflects a move from growth at all costs to more disciplined innovation. GenAI is accelerating investment, but it is also straining budgets.
Economic uncertainty is pushing leaders to justify every dollar. Waste is also rising sharply. Enterprises lost more than 104 million dollars in 2024 due to underused technology and low adoption.
Why innovation spending matters
There is a clear link between innovation investment and long term performance.
Top innovators outperformed the broader market by more than 2% annually, with stronger gains during the Great Recession and the pandemic. Innovation spending often acts as a hedge during downturns and compounds over time.
But there is a caution.
From 2021 to 2024, the number of executives who viewed their companies as innovation leaders fell by nearly a quarter. Spending alone does not create leadership. Execution determines outcomes.
Geographic breakdown: location shapes innovation strategy
United States: the AI epicenter
The United States accounts for nearly half of global R&D spending. Private sector investment rose from $399 billion in 2018 to $655 billion in 2022. Growth is concentrated in software, pharma, hardware, and automotive. Software and ICT companies routinely invest 14-20% of revenue in R&D.
Federal investment remains strong, with more than $200 billion dedicated to science and technology in the 2024 budget. AI dominates private sector activity, capturing over 80% of all US venture capital investment in 2024.
Typical benchmarks range from 3-8% of revenue across the Fortune 500, 14-20% for tech, and 3-6% for traditional industries.
Europe: steady, strategic, automotive led
Europe features more than 350 of the world’s largest R&D investors and allocates more than 219 billion euros annually.
Automotive giants like Volkswagen, Mercedes Benz, and Bosch dominate total spend. Nordic regions maintain some of the highest innovation performance scores, while the EU benefits from more consistent government support than the US.
Benchmarks vary from 5-10% in Germany, 6-12% in Nordic countries, and 3-6% in Southern Europe.
Asia Pacific: the rising giant
Asia Pacific remains the fastest growing innovation region. Technology spend is projected to reach $710 billion in 2024 and to exceed $876 billion by 2027. Software is the fastest growing category.
China leads with more than 200 billion euros in corporate R&D, driven by firms like Huawei and Tencent.
Japan and South Korea continue to strengthen investment in electronics, semiconductors, and mobility.
Southeast Asia is accelerating digital transformation, supported by $74 billion of regional tech spend.
Typical allocation ranges: 8-12% in electronics, 6-10% in software, and 4-7% in manufacturing.
MENA: the emerging innovation hub
The MENA region is undergoing a government driven innovation transformation. IT spend is expected to surpass $230 billion in 2025. Software spending will grow by nearly 14%, driven by GenAI applications.
Saudi Arabia is the largest technology market, while the UAE leads in venture deal volume. AI, cybersecurity, cloud, and data center technologies dominate priorities.
Benchmarks: 8-14% for banking and fintech, 5-8% for energy, and variable budgets for public sector programmes.
Comparative summary
Below is a consolidated snapshot of global innovation budget benchmarks:
- United States: 3-15% of revenue across industries
- European Union: 5-10%
- Asia Pacific: 4-12%
- MENA: 5-14%
Geography shapes not just budget size but strategic priorities and competitive expectations.
Industry deep dive: sector specific benchmarks
Pharmaceuticals and biotechnology: the R&D champions
Pharma leads all sectors with R&D intensity near 19% of revenue.
Leaders such as Merck, Novartis, and AstraZeneca each invest more than 9 to 30 billion dollars annually. Long development cycles, large clinical trial costs, regulatory pressure, and the patent cliff all drive spending.
AI powered discovery tools are accelerating adoption, and many companies recorded double digit R&D growth in 2024. Benchmarks range from 12-25% for established players and significantly higher for early stage biotech.
Automotive: the electric transition premium
The automotive sector invests around 5% of revenue in R&D, often rising to 10% for EV first companies. Global spending reached 145 billion euros in 2022 and continues to grow at double digit rates.
Most funds target EV platforms, batteries, autonomous systems, and connected car technology. European OEMs lead in absolute investment, while Chinese companies are growing fastest. Benchmarks span from 4-15% depending on company type.
Banking and financial services: the digital transformation imperative
Traditional banks allocate 3-7% of revenue to innovation, while digital first banks spend 10-15%. Payment processors operate near 8-12%.
Budgets are driven by cybersecurity, cloud migration, customer experience, AI, and regulatory technology.
High performers allocate nearly half of innovation budgets to revenue generating initiatives, while low performers spend most on maintenance.
Software and ICT services: innovation is the product
Software and ICT operate at 14-20% R&D intensity, with SaaS companies often higher. Early stage SaaS businesses spend 35-50% of revenue on R&D, while public SaaS companies typically invest 15-25%.
Investment is focused on GenAI, cloud scaling, security, and developer tooling. Benchmarks range widely depending on stage.
Consumer goods and retail: the efficiency innovators
Consumer goods companies spend 2-4% of revenue on R&D, and retailers often spend as little as 1-3%. Historically low margins and operational complexity limit budgets.
Spending is now accelerating in supply chain technology, e-commerce, personalisation, and sustainability. Benchmarks vary from 1.5-7% depending on the segment.
Enterprise stage: size and maturity matter enormously
Fortune 500 and large enterprises
Large enterprises spend the most in absolute terms but often invest a smaller%age of revenue. Typical innovation budgets range from 3-6%, though sector differences are significant.
Most operate multiple innovation models, including venture client programmes, CVC arms, accelerators, and M&A. Yet these companies face challenges with bureaucracy, slow deployment, and innovation theatre.
Scaleups
Scaleups invest heavily in innovation. SaaS scaleups often spend 25-40% of revenue on R&D, while non SaaS scaleups spend 15-25%. The focus is shifting from speed to efficiency as hiring slows and infrastructure becomes a priority.
Mid market companies
Mid market firms plan to increase tech spend in 2024, especially in cloud, SaaS tools, digital transformation, and cybersecurity. Typical allocations fall between 4 and 10% of revenue depending on industry.
These companies move faster than enterprises but often underestimate their innovation needs.
Small businesses
Small businesses operate with lean budgets, typically around 1-3% of revenue. Innovation is embedded in day to day operations rather than centralised in a dedicated function. Spending focuses on essential tools such as marketing software, CRM, and basic cybersecurity.
The 2024 to 2025 reallocation: where money is moving
From exploration to execution
Companies are reducing spending on speculative labs and duplicative internal programmes. They are redirecting funding toward clean energy, defence tech, healthtech, and GenAI with clear returns.
The GenAI budget explosion
Global AI spending will surpass $200 billion in 2025. GenAI is driving software spending across regions. Yet many deployments struggle due to data readiness, talent shortages, and weak planning.
GenAI budgets typically flow to infrastructure, talent, pilots, production rollouts, and governance.
The waste crisis
Underutilised technology is now a major drain on innovation budgets. Companies routinely underestimate the number of applications in use and overspend on cloud. Employees lose more than a month of productivity per year due to technology friction.
Budget visibility and adoption capability matter as much as investment level.
Venture capital reality
VC deal values are rising again, but deal volume continues to fall. Investment is consolidating into late stage winners. Corporate innovation teams face fewer partnership options and higher pricing for top tier startups.
How to benchmark yourself: a practical framework
Step 1: define your comparison cohort
Getting innovation budget benchmarks right starts with choosing the right peers. If your cohort is wrong, every comparison that follows will mislead you.
Start by looking at geography. You need to distinguish between the place where you compete and the place where you innovate. A US headquartered company that does most of its R&D in India will experience very different cost structures and talent dynamics than a firm with all its labs in Boston. Both locations matter for a complete view.
Then clarify your industry. Use standard industry codes if you can, and be explicit about your primary sector.
If you are a medical device company, your benchmarks will be closer to pharma and hardware than to pure software. If your business is converging with another sector, note those adjacencies, but avoid direct comparisons that do not make sense. A retail chain should not benchmark its R&D intensity against biotech.
Next, define your stage. Revenue bands matter a lot. A company at 10 to 50 million in revenue behaves very differently to a business above 5 billion. Employee count and public versus private status also change the pressure profile.
Public companies live under quarterly scrutiny. Private businesses may have more flexibility, but also tighter cash constraints. Finally, consider your business model. B2B SaaS, B2C marketplace, industrial manufacturer, and consumer brand each have different innovation cadences.
Step 2: calculate your current allocation
Once you know who you truly compare to, the next step is to work out what you are actually spending.
Total innovation spend is almost always larger than the official “R&D” line. It includes salaries and overhead for:
- R&D teams
- external research and engineering contractors
- innovation tools and platforms
- pilot programmes and proof of concept projects
- corporate venture investments
- accelerator or incubator operations
- dedicated innovation team costs
- strategic partnerships that are focused on new capabilities
Many organisations forget whole categories.
IT infrastructure that supports new products, training and enablement for new tools, compliance and intellectual property costs, and the write off from failed projects all belong in the calculation.
If it is money spent on creating, testing, or scaling something new, it is part of your innovation budget.
Once you have your total, the formula is simple: total innovation spend divided by total revenue. This gives your innovation intensity percentage, which you can compare to your geographic, industry, and stage benchmarks.
Step 3: context adjust your benchmark
Innovation budget benchmarks are a starting point, not a verdict. You need to adjust them to your context.
You would lean toward the upper end of your range if you are facing patent cliffs, undergoing a major digital transformation, entering new markets, or operating in an industry where disruption is accelerating, such as automotive moving to EVs.
Regulatory shifts that create new revenue opportunities also justify higher allocations, as does clear evidence that competitors are out innovating you or that your product portfolio is ageing.
You might lean toward the lower end if you have a strong product portfolio with a five year runway, enjoy durable market leadership with real moats, have just completed a major acquisition that requires integration, or are under intense pressure to improve profitability.
A history of poor innovation ROI may also argue for holding spend steady while you fix the operating model.
If you are near the benchmark, hitting your innovation targets, and experiencing a stable competitive position, maintaining your allocation may be the smartest move.
The key is to explain why you sit where you sit relative to the benchmark, rather than treating the number as a rule.
Step 4: assess portfolio mix
The next step is to look inside the budget itself. Even if your total spend matches your innovation budget benchmarks, a poor internal mix can undermine results.
A common best practice is the 70, 20, 10 portfolio. Around 70% of spend supports core or horizon one innovation, which improves existing products and processes.
20% funds adjacent or horizon two initiatives, which extend current offerings into nearby markets or customer segments.
The final 10% goes to transformational or horizon three bets that create new to world products, services, or business models.
Most companies claim to follow something like this, but their actual spending tells a different story. It is common to see 80-90% going to core, less than 5% to truly transformational work, and the rest scattered.
The result is lots of incremental innovation and few real breakthroughs.
You should also check your tool mix. Internal R&D remains the foundation and will often represent 50 to 70% of total innovation spend.
External partnerships, including pilots with startups and joint ventures, tend to grow toward 20-35% as maturity increases.
M&A is episodic but important in certain industries. Corporate venture capital can be powerful, but it is optional, even if many large enterprises use it.
A well balanced portfolio and tool mix matter at least as much as the headline percentage of revenue.
Red flags: when your budget is wrong
You are overspending if
You may be overspending when your innovation to revenue ratio is more than twice your sector benchmark and you do not have a clear strategic reason.
Other warning signs include overlapping initiatives with no single owner, labs and incubators that operate separately from business P&L, and leadership teams that struggle to explain the ROI of innovation spending.
If your innovation budget is growing faster than revenue while few new products or services launch, or if your innovation team is larger than your core product team in a non software company, it is a sign that spending has run ahead of outcomes.
This is when innovation theatre, FOMO on GenAI, weak governance, and the desire to defend a budget can quietly replace actual value creation.
The remedy is uncomfortable but straightforward.
Conduct a portfolio audit, stop projects that are not moving the needle, and connect innovation work to clear business metrics.
In practice that means reducing open ended exploration and putting more resources into execution and scaling of what works.
You are underspending if
On the other side, you might be underspending when your allocation is less than half of your sector benchmark. Other signals include having no dedicated innovation resources, an empty product or project pipeline beyond the next twelve months, and a pattern of competitors launching new offerings faster than you.
If you struggle to attract or retain top technical and product talent, see market share decline, or have customers leaving because your proposition feels stale, your issue is not just efficiency. You are under investing in the future.
Often this stems from short term financial pressure, overconfidence in a cash cow, a lack of innovation know-how, or cultural resistance to change.
The response should start at board level. You need an explicit innovation strategy, a comparison with competitors who are already under pressure, and a series of smaller bets that build capability without overwhelming the business.
You are spending poorly if
There is a third scenario that is more common than either overspending or underspending. You might be spending roughly the right amount but allocating it poorly.
Typical symptoms include more than 80% of the budget going to keeping the lights on activities that simply maintain existing systems, very few metrics beyond money spent, and a budget that looks almost identical every year because it is driven by historical precedent rather than strategy.
Another red flag is application sprawl. Executives believe there are a few dozen applications in use. The reality is often several hundred. This is why some enterprises waste massive sums each year on underutilised technology.
In such cases, the problem is not the size of the innovation budget but the lack of visibility and adoption.
Fixing this requires a technology and project audit, a focus on enablement before new purchases, and innovation metrics that track both outputs, such as launches, and outcomes, such as revenue and margin impact.
2026 outlook: what is coming
Macro trends affecting budgets
Looking ahead, several macro trends will shape how innovation budget benchmarks evolve.
First is economic pressure.
Global R&D growth is slowing in percentage terms, even as absolute spending remains high. Inflation has increased input costs, and higher interest rates make capital more expensive.
As a result, efficiency is becoming a higher priority than simple growth, and finance teams are scrutinising innovation budgets more closely.
Second is the rise of AI in every sector.
AI and GenAI captured the majority of venture capital investment in 2024, and every industry is reallocating budgets accordingly.
The risk is AI washing, where organisations claim AI initiatives to look modern while overspending on unfocused tools. The opportunity is real productivity gain if you choose the right use cases and prepare your data and processes properly.
Third is sustainability.
Net zero commitments now drive significant investment. Clean energy, circular economy models, carbon capture, and climate related reporting all require innovation.
ESG reporting is not just a compliance exercise. It shapes which projects receive funding and which do not.
Predicted shifts for 2025 to 2026
These trends are likely to produce several shifts in the next two years.
Budgets for GenAI production deployments will probably grow fastest as companies move from pilots to real products.
Cybersecurity and data infrastructure will receive larger slices, since both are prerequisites for safe and scalable AI. Sustainability technology will claim a growing share, especially in carbon intensive industries.
On the other hand, generic innovation labs without clear ROI will continue to see cuts.
Generalist accelerators will likely decline as corporates favour more focused programmes. Exploratory budgets with no clear link to strategy will shrink, and non strategic M&A will remain limited.
New budget categories are also emerging. AI governance and compliance will become a visible line item.
Digital adoption platforms that improve utilisation of existing tools will gain prominence. Climate tech will formalise as its own category, and early stage quantum computing initiatives will appear in forward looking portfolios.
Strategic recommendations
For 2026 planning, three ideas stand out.
- Be more selective
It is better to back fewer, larger bets that match your strategy than to scatter resources across dozens of experiments. - Measure more rigorously
Innovation ROI does not need to be perfect, but it must be visible. - Focus on adoption before new purchases
There is little value in adding another tool if your teams are not using the ones they already have.
You should also be deliberate about whether you build, buy, or partner for each strategic capability. No company innovates in isolation anymore.
The winners will be those who combine appropriate innovation budget benchmarks, a balanced portfolio, clear metrics, and strong execution.
The market intelligence gap: why benchmarking is not enough
The parking lot story at the start of this article captures a deeper problem. The building manager almost certainly had market data. Smart building technology is growing quickly. Competitors had installed similar systems. The budget looked justified.
What nobody asked was a simpler set of questions. What specific problem are we solving in this building? Is parking utilisation actually a constraint? What else could that capital have done for tenants?
The same pattern repeats in corporate innovation.
You can know that US pharma companies spend around 19% on R&D, that Asia Pacific tech spending is racing toward the 876 billion dollar mark, and that your sector benchmark is a certain percentage of revenue. These innovation budget benchmarks are useful, but they only tell you how much others are spending.
They do not tell you which problems those companies are targeting, which technologies are actually working in practice, which startups are worth partnering with, what your closest competitors are building right now, or where the most attractive opportunities sit in your exact market.
This is where many innovation teams get stuck. They have budget, they know the averages, yet they still feel that they are flying blind when it comes to allocation decisions.
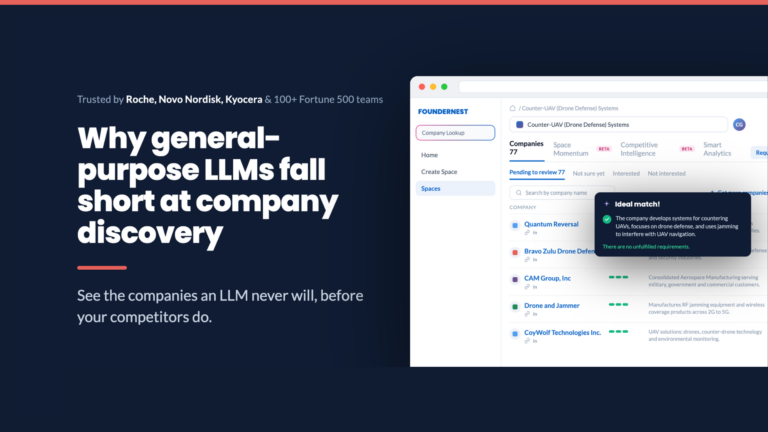
Why we built FounderNest
Traditional approaches to market intelligence struggle with this problem.
We built FounderNest as a personalised market intelligence platform to change that.
We map which companies are addressing the exact problems you care about, track technology trends in your industry and geography, and surface competitive intelligence on peers in your segment.
You see real time changes in the market landscape, from funding rounds and product launches to partnerships and acquisitions. That gives you early warning on threats and early access to opportunities, long before they appear in traditional reports.
When you combine these capabilities, you move from saying “we should spend 6% of revenue like our peers” to “we are allocating this portion of our budget to three clearly defined opportunity areas, partnering with a shortlist of startups, and building one core capability internally, because the evidence shows this is where value will emerge for our business.”
The platform is designed for innovation leaders at large enterprises, corporate development teams, corporate VC investors, strategy leaders, and business unit heads who want their innovation budgets to be a source of advantage rather than a line item to defend.
Get started
If you are planning your 2026 innovation budget, you now have a clear view of the global and sector specific innovation budget benchmarks and a practical framework to interpret them.
The next step is to fill the market intelligence gap, so that you can decide not just how much to spend, but precisely where and why.
That is the problem FounderNest exists to solve. Share your strategic priorities with us, and we can show you the market gap you are currently missing, the opportunities your competitors may not see yet, and the concrete places where your innovation budget should go.
Get a demo of FounderNest today, and see the platform in action.
In the end, the right benchmark is not what everyone else is spending.
It’s the level of investment and the set of choices that give your organisation the best chance to build what actually matters, instead of optimising an already half empty parking lot.
Research sources
- Ayming Institute Innovation Trends 2024-2025: https://www.foundernest.com/insights/where-innovation-budgets-are-shifting-in-2025
- 2024 EU Industrial R&D Investment Scoreboard: https://iri.jrc.ec.europa.eu/scoreboard/2024-eu-industrial-rd-investment-scoreboard
- European Innovation Scoreboard 2024: https://research-and-innovation.ec.europa.eu/statistics/performance-indicators/european-innovation-scoreboard_en
- ITIF Report on US Private Sector R&D (2024): https://itif.org/publications/2024/02/09/a-closer-look-at-us-private-sector-rd-spending/
- White House OSTP FY2025 Budget: https://bidenwhitehouse.archives.gov/ostp/news-updates/2024/03/13/fact-sheet-president-bidens-2025-budget-invests-in-science-and-technology/
- Forrester APAC Tech Market Forecast 2023-2027: https://www.forrester.com/press-newsroom/forrester-apac-tech-spend-forecast-2024/
- Oxford Economics APAC Technology Analysis: https://www.oxfordeconomics.com/resource/healthy-tech-spending-set-for-growth-in-asia-pacific/
- Gartner MENA IT Spending Forecast 2025: https://www.gartner.com/en/newsroom/press-releases/2024-11-20-gartner-forecasts-mena-it-spending-to-grow-7-percent-in-2025
- Insight Partners 2023 ScaleUp Company R&D Trends Report: https://www.insightpartners.com/ideas/product-tech-research-development-report-2024/
- Mind the Bridge Open Innovation Outlook 2024: https://mindthebridge.com/open-innovation-outlook-2024/
- BCG Most Innovative Companies Report 2024/2025: https://www.bcg.com/publications/2025/in-disruptive-times-resilient-win
- WalkMe State of Digital Adoption Report 2025: https://www.walkme.com/the-state-of-digital-adoption-2025
- MAGNiTT Q3 2024 MENA Venture Investment Report: https://d2p9i44hnkrmkx.cloudfront.net/files/research-files/912025/0241605446371-FY2024_EVM_Venture_Investment_Summary.pdf
- Fortune Global 500 Analysis 2024: https://www.kaggle.com/datasets/sneharangole/2024-fortune-global-500-companies
- KeyBanc SaaS Survey 2024: https://investor.key.com/press-releases/news-details/2025/PRIVATE-SAAS-COMPANY-SURVEY-REVEALS-AI-DRIVEN-TRANSFORMATION-AND-SUSTAINED-OPERATIONAL-EXCELLENCE/default.aspx
- Forrester Banking Technology Trends 2024: https://www.forrester.com/report/the-top-emerging-technologies-in-banking-2024/RES180685
- Gartner IT Spending Forecast for Banking 2024-2025: https://www.gartner.com/en/documents/5908275
- McKinsey Retail Innovation Survey 2024
- McKinsey Automotive R&D Trends 2024
- PwC Pharma 2025 Report: https://www.pwc.com/us/en/industries/pharma-life-sciences/pharmaceutical-industry-trends.html
- Gartner Mid-Market IT Spending Report 2024
- Salesforce State of the Connected Customer 2024: https://www.salesforce.com/eu/resources/research-reports/state-of-the-connected-customer-2022/